Last year, on the eve of the fifth anniversary of the mobile revolution, Flurry issued its five-year report on the mobile industry. In that report we analyzed time-spent on mobile devices by the average US consumer. We have run the same analysis, using data collected between January and March of 2014, and found some interesting shifts that we are sharing in this report.
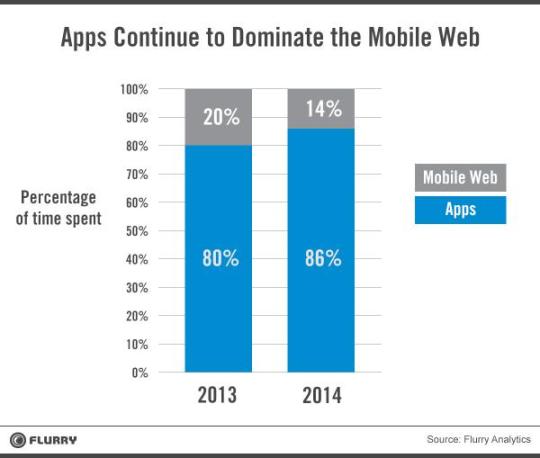
Time spent on a mobile device by the average US consumer has risen to 2 hrs and 42 minutes per day from 2 hrs and 38 minutes per day in March of 2013. Apps continued to cement their lead, and commanded 86% of the average US mobile consumer’s time, or 2 hrs and 19 minutes per day. Time spent on the mobile web continued to decline and averaged just 14% of the US mobile consumer’s time, or 22 minutes per day. The data tells a clear story that apps, which were considered a mere fad a few years ago, are completely dominating mobile, and the browser has become a single application swimming in a sea of apps.

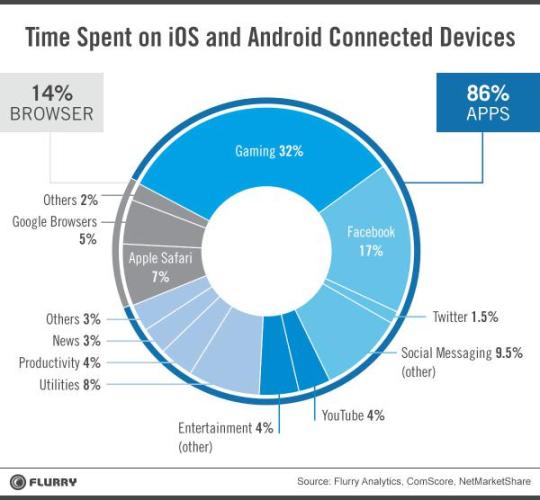
The chart below takes a closer look at app categories. Comparing them to last year, gaming apps maintained their leadership position at 32% of time spent. Social and messaging applications, including Facebook, increased share from 24% to 28%. Entertainement (including YouTube) and Utility applications maintained their positions at 8% each, while productivity apps saw their share double from 2% to 4% of the overall time spent.

Coming back to the overall time-spent on mobile, the average US consumer spent an additional 4 minutes/day on a mobile device compared to last year. That is just a 2.5% year-over-year increase. Time spent in apps was 2 hours and 19 minutes this year compared to 2 hours and 7 minutes last year. That is an increase of 12 minutes per day or 9.5%. This is a modest increase in time spent, yet not as spectacular as the five previous years.
While examining the chart above, it is hard to ignore the time-spent on Facebook. As in the previous year, we placed Facebook (including Instagram) in its own category, albeit in the social segment. In terms of time spent, Facebook still has the lion’s share of time spent in the US. While the social segment grew, driven mainly by messaging applications, Facebook was able to maintain its position with the help of Instagram. That position will be even more cemented, if not increased, by the reach and time-spent inside WhatsApp. This has given Facebook a great degree of confidence on mobile allowing it to start focusing on the next platform. The following statement from Mark Zuckerberg’s post on the Oculus acquisition was very revealing: “We have a lot more to do on mobile, but at this point we feel we’re in a position where we can start focusing on what platforms will come next to enable even more useful, entertaining and personal experiences”.
In this year’s analysis, we have added YouTube as its own segment, albeit in the entertainment category. On its own, YouTube is a whopping 50% of the entertainment category. Google has many other widely adopted apps, such as maps, but we kept those in their respective categories.
Both Google and Facebook have very well established franchises on mobile, but the market is still very fragmented. In fact, Google and Facebook combined probably command less than 25% of the total time spent by the average US mobile consumer. In addition the top ten franchises, according to ComScore, account for less than 40% of the time-spent. So despite massive efforts by Google and Facebook, the market still hasn’t consolidated and over the past couple of years we have seen new franchises emerge in almost every sector of mobile. Apps like Pinterest, Snapchat, WhatsApp (acquired by Facebook), Waze (Acquired by Google), Spotify and many more received wide adoption and commanded a percent or two of the time spent. In short, six years into the mobile revolution, there are numerous opportunities for new franchises to emerge in almost every segment of the mobile economy.
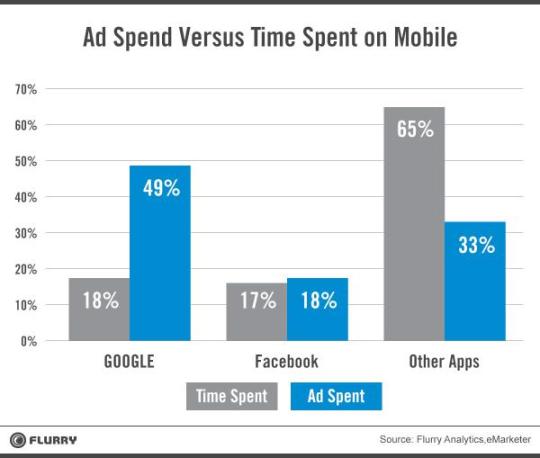
There is an old saying in the world of advertising: “time-spent is the timeless currency”. It means that advertising revenue distribution follows time-spent distributions. As an example, if an app commands 17% of time spent, it should command 17% of the ad revenues for that channel. This is exactly the position Facebook is in right now and this is reflected in the chart below.

According to eMarketer, at the end of 2013, Facebook earned 17.5% of the overall mobile advertising revenues. That is in-line with their share of the time-spent. On the flip side, Google, according to eMarketer, earned 49.3% of the overall mobile advertising revenues, much more than its fair share of time-spent. (For the time-spent analysis, we accounted for YouTube and all the time spent in browsers where Google monetizes search and display.)
There are other display networks and other search monetization players out there, but if we combined mobile search and display ads on the mobile web, Google probably has a high market share in terms of ad revenues. The rest of the apps, including gaming apps, are simply not getting their fair share of advertising spent. The “other” apps command 65.3% of time spent but only receive 32% of ad revenues. This represents a massive opportunity for applications, including gaming apps, to monetize through advertising. eMarketer also projects that the mobile ad market will grow 75% this year, making the opportunity even bigger. In fact, analysts predict that in-app ad revenues will surpass web display ads in 2017.
It is still too early to predict the trajectory apps will take in 2014. But one thing is clear - apps have won and the mobile browser is taking a back seat. Now every company in the world including Google is adjusting to that reality.
Hear more Flurry insights at Source14, our one day mobile summit happening April 22 in San Francisco. Register today.