The era of mobile computing, heralded by Apple in 2007 with the debut of the iPhone, has put powerful, networked computers into consumers’ hands. Onto these devices, consumers have downloaded billions of apps. In 2011 alone, we estimate that 25 billion iOS and Android apps will be downloaded. And Flurry expects that number to roughly double in 2012.
Like other new technology, adoption of iOS and Android devices began primarily in North America and Western Europe, where disposable income is higher. However, as prices have come down for older iOS models, and OEMs supporting Android have offered more affordable down-market devices, we’re seeing a clear shift in consumer app usage to international markets, including emerging economies. Let’s warm up with a chart showing how mobile app sessions are expanding outside of the U.S.
The chart above compares mobile app sessions tracked by Flurry Analytics in January 2011 and October 2011. Flurry now tracks over 20 billion mobile app sessions per month across more than 120,000 applications. The green area shows the percent of app sessions occurring in the United States, the dominant mobile app market. While the absolute number of sessions in the U.S. has doubled between January and October, its share of total sessions has declined from 55% to 47%. This means that the rest of the world is growing faster. Looking at the balance of the top 10 countries (UK, Canada, Australia, France, Germany, Japan, Indonesia, South Korea and China), this group has increased in collective sessions by 2.7 times between January to October, resulting in an increase in total session-share from 28% to 31%. Further, the rest of the world (another 217 countries across which Flurry tracks user sessions), has increased in session-share from 17% to 22%. Among all this growth, there is one country that has caught our attention more than any other.
You may have heard of China, and its 1.3 billion people. In fact, you most likely associate the country with high volume, affordable manufacturing. However, China is also fast becoming one of the world’s most promising consumer economies. Earlier this year, Bloomberg reported that 2010 foreign direct investment in China rose to a record $106 billion. Included in this are investments by companies such as Wal-Mart, which co-invested over $500 million in online retailing. According to the International Monetary Fund, China has the world’s second largest gross domestic product, behind the U.S., and ahead of Japan, Germany and France. Additionally, the Boston Consulting Group released a report in November 2010 forecasting that the number of middle-income and affluent consumers will almost triple in the next 10 years to 415 million. As it relates to mobile, China has the most cellphone users in the world, with over 950 million users according to statistics released by China’s Ministry of Industry last week.
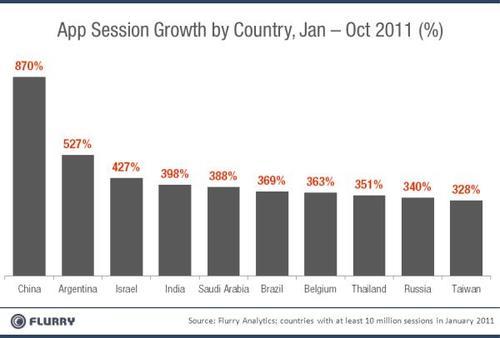
To understand how this translates into mobile app adoption, Flurry compiled a list of the fastest growing mobile app markets in terms of sessions tracked by our service. We show the chart below.

This chart ranks the top 10 countries, in terms of mobile app session growth, from January 2011 to October 2011. To be included in the analysis, countries had to have generated at least 10 million monthly sessions in January. Inspecting the chart, it’s clear that China’s growth is astronomical. While the top 100 countries are averaging session growth of over 200%, China is delivering more than four times this growth rate, spurred by a massive population voraciously adopting applications.
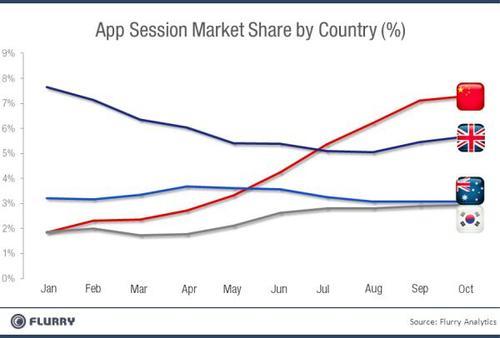
With its hyper-growth in app sessions, China has moved up the ranks among the world’s top countries to now occupy the second spot behind the U.S. The graph below charts China’s share of total mobile app sessions per month, relative to other top countries during 2011. Note that to get a better view of movements among countries ranked second through fifth, we exclude the U.S. from the chart, given its scale.

China, represented by the red line, began the year ranked tenth in terms of app sessions, with 1.8% of all sessions tracked by Flurry. By April, China had climbed to fifth with 2.7% of all sessions, and, in July, overtook the United Kingdom to become the second largest country, with 5.4% of sessions. By the end of October, China had further grown to 7.3% of sessions. The U.S., which declined in sessoin-share over the year, finished in October with 47%. If both China and the U.S. were to continue along their respective trajectories, China could overtake the U.S. by the end of 2013, with both countries converging around 23% app session-share.
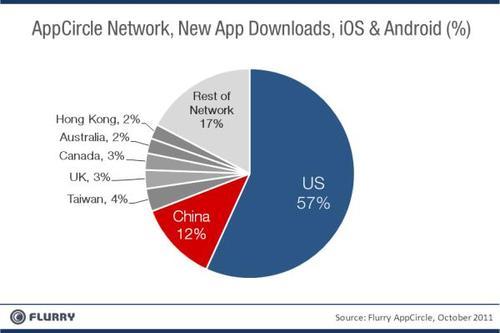
Finally, we took a look at AppCircle, Flurry’s mobile app traffic acquisition network to understand advertising dollars companies are willing to spend on acquisition per market. In this part of the business, we measure from which country consumers are downloading news apps advertised to them. The country of origin is a reflection of geographic consumer demand. Overall, downloads of new apps from China grew from 1.2% to 12% over the course of the year, from January through October. Similar to the total growth we saw in Flurry Analytics user sessions, the Flurry AppCircle network grew by 2.5 times. The chart below shows AppCircle-driven downloads per country for the month of October 2011.

Whether studying China by existing app session generated or new demand for apps, the growth rates are similar. As one of the fastest modernizing and largest countries in the world, the adoption of mobile apps in China is unprecedented. For app developers, who more traditionally look at North America and Europe, China is a market too compelling to ignore. A new market has emerged, and China is the new mobile app dragon.