The economic boom created by Apple and Google through their iOS and Android platforms has precipitated a renaissance among entrepreneurial developers. With some of the lowest barriers to entry in the history of software development and distribution, apps are getting built and downloaded at breakneck speeds. Earlier this month, Apple crossed a record 25 billion downloads from more than 550,000 available apps. Google announced in December 2011 that it had crossed 10 billion downloads from 400,000 available apps.
As markets mature, rational economic behavior emerges. Even the most passionate, idealistic software start-ups focus increasingly on markets where revenue generation is highest. In this report, Flurry compares the ability for app developers to generate revenue per user across the major app stores. We examine a basket of top-ranked apps that have similar presence across iOS, Amazon and Android. Their primary business models are in-app purchase, which is the revenue type we compare for this analysis. Additionally, earlier research by Flurry found that the in-app purchase revenue model generates the majority of revenue for apps. Combined, these apps average 11 million daily active users (DAUs). We measured their revenue per user over a 45-day period, from mid-January through the end of February 2012.

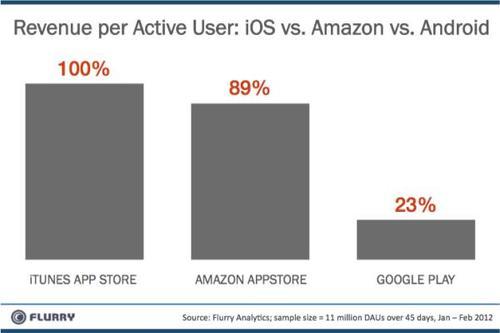
The chart above compares revenue generated per user across iOS, Amazon and Android app stores. We start by taking the revenue generated per user in the iTunes App Store and setting it to 100%. We then compare the relative revenue generated per active user from Amazon and Google to the amount of revenue per active user generated by the iTunes App Store. Doing so, we find that Amazon Appstore revenue per active user is 89% of iTunes App Store revenue, and Google Play revenue per active is 23% of iTunes App Store revenue. Another way to interpret the results is that, for the same number of users per platform, every $1.00 generated in the iTunes App Store, will also fetch $0.89 in the Amazon Appstore and $0.23 in Google Play. These results mirror those of a similar analysis conducted by Flurry last December, where we found for every $1.00 generated per user in the iTunes App Store, developers generated $0.24 per user in the Android Market.
Amazon’s bet to fork Android in order to put consumers into their own shopping experience on Kindle Fire appears to be paying off. Showing its commerce strength, Amazon already delivers more than three times the revenue per user in its app store compared to what Google generates for developers.
For some possible insight, let’s consider the DNA of each company. Apple runs the highest revenue-per-square foot generating retail store on the planet as well as the successful iTunes store. Amazon, who invented the one-click purchase, perfected online shopping with data, efficiency and customer service. Google’s strength is in scalable online search engine and advertising technology. Running a store, retail or digital, has not been Google’s traditional core competency.
As developers make decisions to support different platforms, the ability to generate revenue per user will always be a key factor. Based on revenue potential, we expect to see an increasing number of developers support Amazon. We also believe that companies such as Samsung, the leading Android-supporting OEM, could also consider emulating Amazon’s move to fork Android. Google, who recently saw the departure of Eric Chu, the most public-facing proponent of Android Market improvement, will need to reduce commerce friction to maintain strong developer support. From an ecoystem perspective, the emergence of Amazon as an additional distribution channel appears to be a boon for developers.
[UPDATE: For clarity, I went back through this post and specified, where appropriate, including in the title of the chart, that the revenue comparison in this analysis was per user, not total revenue generated. Peter]