We conducted a webinar to highlight recently released features and how to get the most out of the new Flurry platform. Check out the video below to see how you can leverage the New Flurry to get actionable insights and grow your app. The recording includes an update on our transition plans, an overview of recently added features, a hands-on demo of the new platform by Product Director Brad Jones, and a Q&A session. Thanks to everyone that joined!
We got a lot of great questions during the webinar and here are some of the frequently asked ones:
How do I see absolute numbers instead of charts?
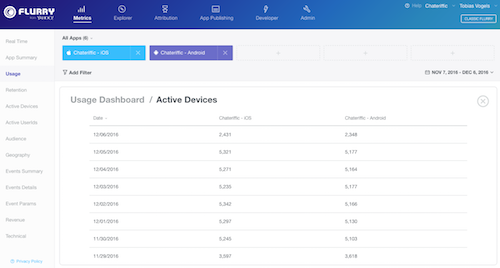
You can click on every chart to get more detailed information including absolute numbers for a selected metric.

Additionally, if you select only one app in the metrics section, you’ll see absolute numbers for top-level metrics of the selected app.
What’s the difference between Return Rate and Rolling Retention on Flurry?
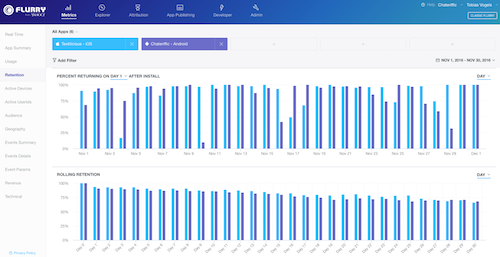
Flurry has two main retention metrics: Return rate and rolling retention.

Return rate measures the percentage of how many people were active on a specific day after installing your app. For example, percent returning on day 7 looks at the cohort of users that installed your app on day 0 and monitors what percentage of this cohort was active exactly 7 days later. Rolling retention displays the opposite of your churn rate and is a measurement of what percentage of your users were being retained over a specific time frame. For example, a day 7 rolling retention metric tells that x % of users that installed your app on day 0 were not churned until day 7. This means they were active on day 7 or after.
Will the new Flurry platform have company metrics?
Yes, we will add company metrics to the new platform soon. Unlike in the old Flurry, “company” will not be its own section.

Once it’s released, you can access your company metrics via the app selection tool: Go to the usage dashboard, hit the “+” button and select the group “All Apps.”
How do you track how users navigate through the app on the new Platform?
We will add a user path functionality to Flurry Explorer which will allow a more detailed analysis of the user flow than user paths on the Classic Flurry. We’re actively working on adding this feature as soon as possible.
How can I access and download event logs on the New Flurry?
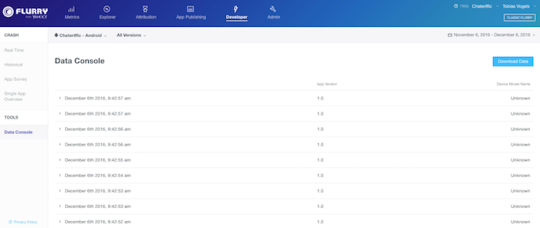
You can download your event logs from the Data Console page.

To track our in-app purchase revenue, do we need to add any specific code?
Please check out our documentation to see how you can setup revenue analytics.
If you have any other questions/feedback, please reach out to support@flurry.com