With the 2016 Rio Olympics starting today, we decided to take a look at smartphone and app growth in Latin America. Though the region has been slower to adopt mobile apps in years past, largely a result of limited high-speed data connectivity, this study dives into YoY growth (2015 vs. 2016) in both smartphone adoption and mobile app engagement. As Rio takes the global stage, we have no doubt that all eyes, in and out of Latin America, will be on their smartphones.
The Flurry SDK resides in 22,700 apps developed by 5,411 companies based in Latin America, across 252 million devices. Flurry sees 25 billion sessions every month in the region.
Apple Loses Market Share, While Device Count Sees Double Digit Growth
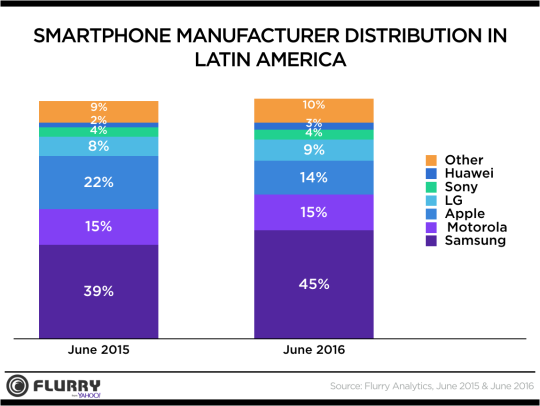
As more Latin American users gain access to smartphones, we wanted to understand which device manufacturers were winning market share in the region. Flurry tracked 10% year-over-year growth in active devices between June 2015 and June 2016; from 230 million to 252 million. While some estimate device penetration to be around 180 million devices, we measured 70 million more active devices in the region in June 2016. When broken down by manufacturer, Samsung gained 6% market share between 2015 and 2016, for a total of 45% of all active devices. Apple’s market share declined by 8% between 2015 and 2016 going from 22% of active devices to only 14% in 2016. Interestingly enough, Motorola maintained its market share at 15% and now holds the number two position in the region.

The growth and dominance of Android devices provides great opportunity for Hauwei and other hardware players trying to expand into the United States and the Americas.

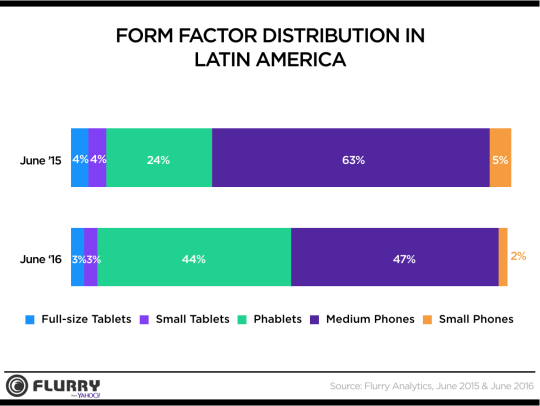
Latin America is following global trends of phablet adoption, with phablets taking share from all device form factors between June 2015 and June 2016. Where LATAM differs from global trends is the permanence of small phones. Although the number of active small phones dropped 3% YoY, the percentage of small phones in the region exceeds global benchmarks and trends. This is indicative of the lifecycle and maturity of the marketplace, with users just beginning to adopt larger and more recently released smartphones.
Brazil and Mexico Account For More Than Half of All Sessions

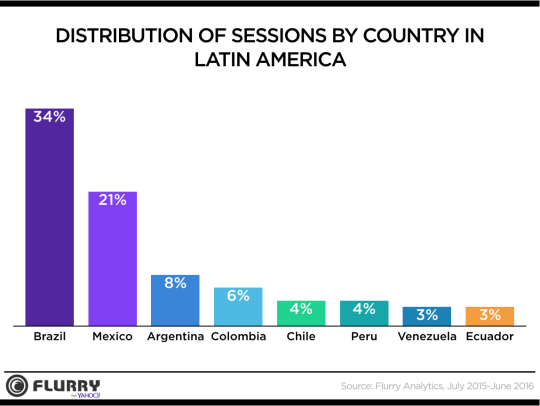
While the top 8 countries driving sessions mirror the top most populous countries in the region, we found that Brazil and Mexico make up 55% of all sessions over the last year. This can likely be tied to size of each country’s population, maturity of economy and GDP, and users’ access to high speed data connectivity. This is a key measure to keep in mind for developers looking to invest in the region and where they should allocate resources when looking to drive adoption of their products.
The Dominican Republic (690M sessions) and Bolivia (538M sessions), while not ranking in the top 10 countries for sessions, had the highest year-over-year growth in session activity, with 116% and 155% respectively.
Top App Categories Mirror Global Trends; Opportunities Galore for Devs
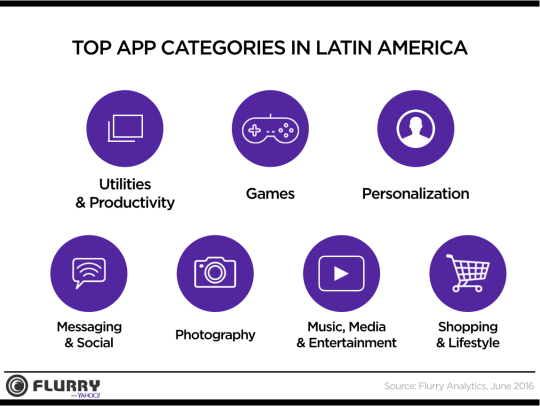
While smartphone device adoption may differ in LATAM from the rest of the world, users in the region are finding similar value in the apps they use. We broke down sessions by category to identify the top app categories for Latin American users:

The prevalence of Android devices is why Utilities/Productivity and Personalization apps are so popular in the region. All other categories mirror the growth and trajectory of other regions as users adopted smartphones and fully integrated them into their daily lives. Latin America presents the rare opportunity to introduce product experiences to a user for the first time. As connectivity in the region explodes and more users integrate apps into their lives, 2016 is an ideal time for app developers to make their mark in Latin America.