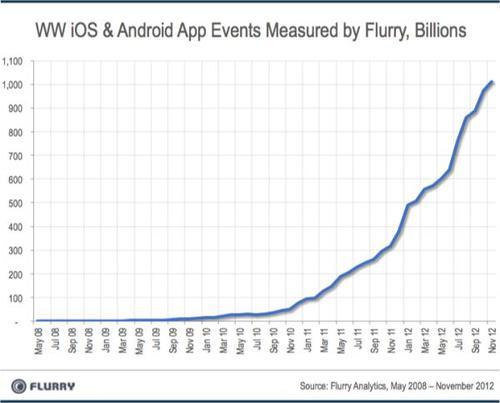
During the month of November, Flurry reached a major milestone, measuring more than a trillion unique events completed inside of mobile apps by consumers. The magnitude of this number, and what it means to an industry barely over four years old, that has already generated tens of billions of dollars, is unprecedented. An industry has shot up around Flurry in a way that no one, anywhere, could have imagined.
So it was against this backdrop that I began reading a series of differing investment theses written by Fred Wilson of Union Square Ventures (What Has Changed), Dave McClure of 500 Startups (What Hasn’t Changed) and Chris Dixon of Andreessen Horowitz (The Product Lens). The gist was about the cyclical nature of investing between consumer internet and enterprise companies, with another suggestion to focus on product over finances. The debate is entertaining, and not surprising. It validates a theory I’ve held since the mid-nineties about the fundamental difference between entrepreneurs and investors. Simply put, entrepreneurs focus on opportunity while investors focus on risk.
The venture industry wants familiarity, so it talks about consumer versus enterprise. The web comes with an understood set of metrics like page views, visits, unique users, returning visitors and bounce rates, to name a few. And there’s still a standard way of buying traffic (SEM) and getting traffic organically (SEO). There’s a clear index and path to the web, called Google, and most VCs understand Google economics. They understand the lifetime value vs. cost per acquisition equation. They can value businesses accordingly.
What the venture industry doesn’t yet understand is mobile and apps. Traffic acquisition is still an art more than a measurable science. No one has defined a set of metrics that the venture industry can use to universally compare the value of one app property to another, and business models on mobile are still new. On Sand Hill Road, the best line I hear is that “99 cents is the new free,” referring to the freemium model, but few truly understand what it means.
Mobile and apps are gobbling up the web and consumer Internet, and that’s where the opportunity is. And the opportunity has never been bigger. All around me, I see entrepreneurs living it, loving it and collecting it “99 cents” at a time. Meanwhile, the VCs are debating it.
In the month of November, we measured over a trillion events from over 250,000 applications created by more than 85,000 developers. Events are actions completed by consumers inside apps such as completing a game level, making a restaurant reservation or tagging a song. In November, we also measured over 60 billion sessions, which is the start and a stop of an application on a mobile smart device. The chart below shows the growth in events tracked since May of 2008, when we first made our analytics service available to developers. This growth reflects the growth of the app economy.

The chart below updates Flurry’s analysis comparing time spent in mobile apps on smartphones and tablets to time spent on the web using a browser. For web usage on desktops, laptops and smart devices, we build a model using publicly available data from comScore and Alexa. For mobile applications, we use Flurry Analytics data, now gathering data from over 250,000 applications. This time around, we add time spent on television using data released by the United States Bureau of Labor Statistics for 2010 and 2011. Note that the bureau hasn’t yet released their 2012 numbers, but given the maturity of the TV market, we assume that time spent on TV is flat year-over-year.

Between December 2011 and December 2012, the average time spent inside mobile apps by a U.S. consumer grew 35%, from 94 minutes to 127 minutes. By comparison, the average time spent on the web declined 2.4%, from 72 minutes to 70 minutes. By our measurement, U.S. consumers are spending 1.8 times more time in apps than on the web.
The chart also shows that time spent in apps already totals 76% of time spent on television. With new content released via thousands of new apps each day, we expect this trend to continue. In fact, we ultimately expect apps on tablets and smartphones to challenge broadcast television as the dominant channel for media consumption. Compared to the 60-year-old television industry, apps are just over 4 years old. In particular, tablets will drive growth in app consumption in 2013 as TV-style content and major programming moves to the tablet. Most TV Networks have already adjusted to a dual screen world and are synchronizing their TV content with their tablet app content. We believe that, with the introduction of connected TVs, TV shows will behave like apps.
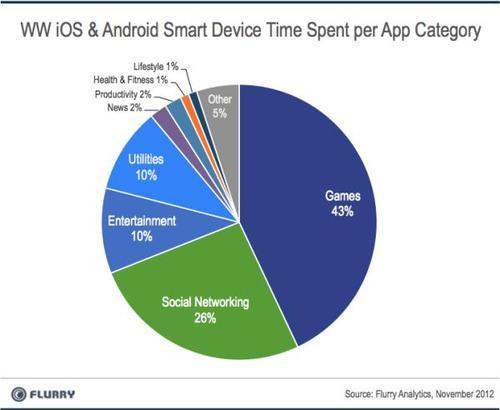
Finally, we measured the time spent using mobile apps per app category across iOS and Android smart devices. For this comparison, we use Flurry data over the month of November 2012 as a baseline, and then adjust based on Flurry’s penetration per category. The chart below shows that 80% of the total time spent is across gaming, social networking and entertainment categories.

The stats on gaming are particularly interesting. Returning to the Bureau of Labor Statistics survey data, the average U.S. consumer spent 1.2 hours (72 minutes) per day playing a game, on any platform. Our data shows that 43% of time spent in mobile apps, 55 minutes, is spent in games. This means that mobile gaming on tablets and smartphones has absorbed 76% (55 of the 72 minutes) of the total time consumers spend on gaming, anywhere. Now, that’s disruptive.
In just 4 years, mobile apps have overtaken the web and are beginning to challenge television, the top media channel. As we enter 2013, the app industry shows no signs of slowing. On the contrary, we continue to see a strong flow of new devices and new apps activated in our network. While VCs debate what part of the investment cycle we’re in and how to manage risk, all entrepreneurs need to know - from one entrepreuneur to another - is that you’re witnessing the opportunity of a lifetime.