November 18, 2014 | Simon Khalaf
In December of 2012, Flurry released an analysis on the rapid growth of time spent inside mobile applications. In a post titled “Mobile apps: We Interrupt This Broadcast” we talked about how mobile and its apps have put the desktop web in their rearview mirror and set their sights on television. Since then, apps have continued to steal share from the desktop as companies joined the mobile revolution and built apps at a pace faster than websites were built in the late nineties and early 2000s.
Recently, a chart buried deep in a presentation by Benedict Evans, a highly respected mobile and telecommunications analyst turned a16z venture capitalist, prompted us to revisit our analysis of how consumers are spending their time. His chart showed that TVs account for only 24% of all devices that have access to video content. What we found is even more interesting.
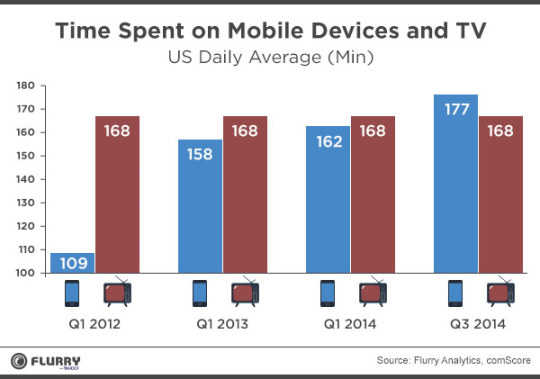
Mobile Has Bumped TV as America’s First Screen
In our analysis, we found that time spent on mobile devices grew in the US by 9.3% - from 2 hrs and 42 minutes to 2 hrs and 57 minutes - in the past nine months. That is almost 3 hrs per day spent on mobile devices by the average American consumer, while time spent on TV has remained flat at 2 hrs and 48 minutes daily, according to the US Bureau of Labor Statistics.

While we don’t have a way to measure the overlap in time spent, other than our own families’ experiences, we believe that there is plenty of overlap between the time spent on TV and that on mobile devices. It is a tall order to believe that the smart device (and app) industry, which didn’t exist six and half years ago, can take out an industry entrenched in every American household since the middle of the last century. But it has happened. Smart devices are practical, and areglued to consumers 24/7/365. Those factors, combined with the content explosion on these devices through millions of apps, helped mobile snatch the big prize from television. As of September 2014, it is a new world in the American living room.
Independent App Developers Driving Growth
As we look back, we’ve seen indicators of this incredible mobile growth in the last year. Consumers turned to mobile apps to stay fit, stay organized and productive, or stay up to speed on their favorite sports. As more consumers use mobile devices for almost every daily task, it seemed only logical that they would turn to their phones more often than their TV sets.
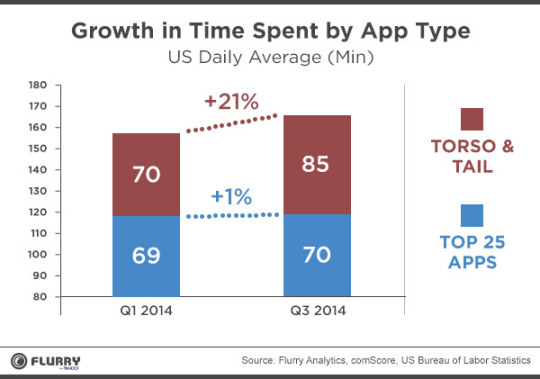
In our analysis, we found that the growth in time spent didn’t come from the top applications. In the past nine months, time spent in the top 25 applications (ranked by time spent according to comScore) only grew by one percent. But time spent in the group of apps that we call “torso and tail,” which are apps below the top 25, grew a massive 21 percent in the same time period, as more and more applications made their way into the top app stores. Time spent on the mobile web remained flat.

The above chart is proof that independent developers have survived attempts by large players to consolidate the ecosystem. In fact, it looks like they are thriving, if time spent is a good measure. Developers from 180 countries have added over 110,000 applications on the Flurry network in the past nine months, pushing the total number of applications on the Flurry network to 590,000 applications. With a hope, a few prayers, and some marketing dollars, it looks like these developers will continue their relentless effort to reach the more than 1.5 billion devices worldwide and earn a portion of consumers’ time.
Not only is this a big moment for the mobile industry, this is a big moment for the app industry. Most app developers didn’t know back in 2008 that they would be building the next generation of TV channels. Many consumers installing apps also didn’t know that they were tuning in to new TV channels. All I know is when I am in our living room, I have got a smartphone on my right, a tablet on my left and a TV remote control somewhere under a couch cushion.