Android has been a hot topic lately, with some arguing that it may become a unilateral smartphone superpower and others arguing that it has already peaked in the US market. A lot of this conversation seems to assume that Android’s (and by extension, Google’s) gain is Apple’s loss and vice-versa. We believe that the situation is more complex than that.
Two facts about Android are now well established: 1) Android smartphones now dominate many markets in terms of device shipments, but 2) The market for Android devices is famously fragmented. What’s less well-established is how and when all of those Android devices are being used and the implications of that for participants in the Android ecosystem and beyond. Those are the topics that we tackle in this post with a particular focus on Samsung devices and how their owners compare to users of other Android devices.
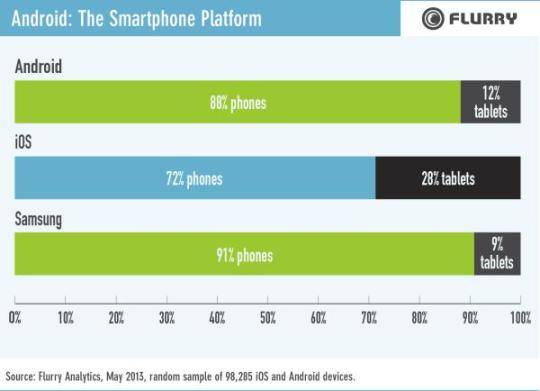
This posts builds on a previous one we did exploring how people use iOS smartphones and tablets. As we will show, there are many similarities in usage patterns across the two operating systems, but one big difference is the overall breakdown between smartphones and tablets. In this May sample of 45,340 Android devices (of the 576 million Flurry measures), 88% were phones and 12% were tablets. The share of devices represented by smartphones is significantly greater than in our iOS sample, in which 72% of devices were phones. The emphasis on phones over tablets was even greater among Samsung devices in our sample: 91% were smartphones and 9% were tablets.
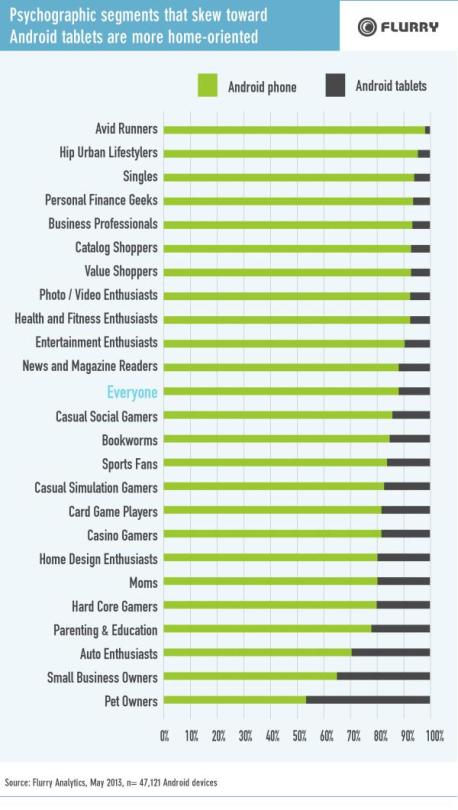
As in our previous post, we started our analysis by considering how the smartphone versus tablet distribution varies by psychographic segment. These are Personas, developed by Flurry, in which device users are assigned to segments based on their app usage. An individual person may be in more than one Persona because they over-index on a variety of types of apps. Those who own more than one device may not be assigned to the same Personas on all of their devices because their app usage patterns may not be the same across devices.
The Personas shown above the “Everyone” bar in the graph below skew more toward phones than the general population of Android device owners, while the Personas shown below the “Everyone” bar skew more toward tablets. (Android device ownership patterns for Personas not shown are not statistically different from those shown for “Everyone.”) In general, these follow a similar pattern to the one we saw for iOS. On-the-move type Personas, including Avid Runners, skew toward phones and more home-bound personas, such as Pet Owners, skew more toward tablets.
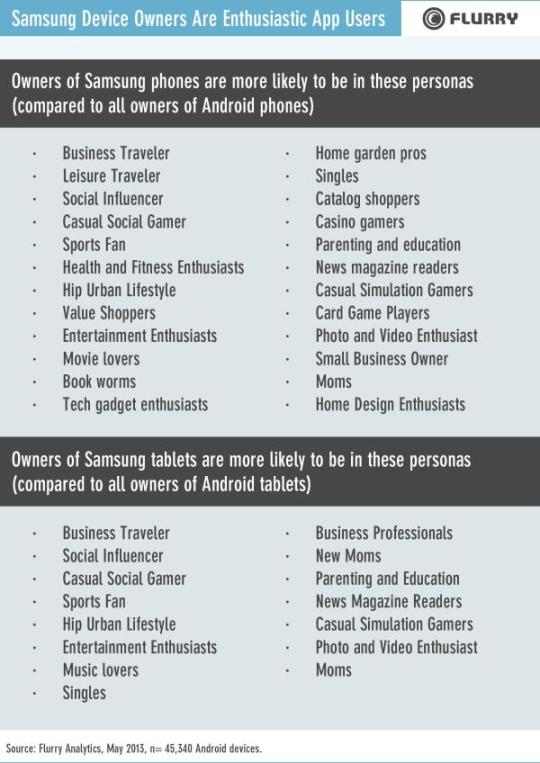
Within that broader pattern, there were differences based on the particular Android smartphone or tablet that a person owns. Samsung is the dominant manufacturer of Android devices. Its phones represented 59% of the phones in our overall sample of Android phones, and its tablets represented 42% of the tablets in our sample. Both its products and its promotion suggest that Samsung attempts to differentiate itself from other devices that share the Android operating system, and those differences were reflected in persona memberships.
Owners of Samsung devices were disproportionately likely to be in many personas, including some of those most sought-after by advertisers (e.g., Business Travelers and Moms). Since Persona memberships are based on over-indexing for time spent in particular types of apps, this suggests that Samsung device owners are generally more enthusiastic app users than owners of other brands of Android smartphones and tablets.
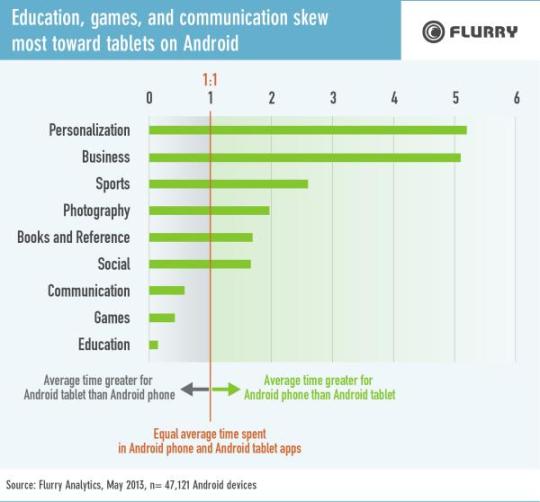
Overall, owners of Android tablets spent 64% more time using apps than owners of Android smartphones. This ratio varied by category, as shown in the chart below. For example, owners of Android smartphones spent more than five times as much time, on average, in Business apps as owners of Android tablets. Sports and Photography were other categories that heavily favored phones. As with iOS, Education and Games skewed more toward tablets. (Average time spent using app categories not shown does not differ in a statistically significant way between Android smartphones and tablets.)
Once again there was variation by manufacturer. Overall, owners of Samsung phones spent 14% more time using apps than owners of other Android phones and owners of Samsung tablets spent 10% more time using apps than owners of other Android tablets. The particular categories of apps where time spent was greater for Samsung phones were News Magazines, Tools, Health and Fitness, Photography, and Education. Owners of Samsung tablets spent more time than owners of other Android tablets in Communication (e.g., voice over IP and texting) apps.
Android app use peaks between 8 and 11 pm. Comparing the two types of Android devices, a greater share of tablet use takes place from 3pm until 11 pm and a greater share of phone use takes place from 11 am to 3 pm and overnight. While the overall amount of time spent on Samsung devices is greater than for other Android smartphones and tablets, the overall time distribution throughout the day is similar.
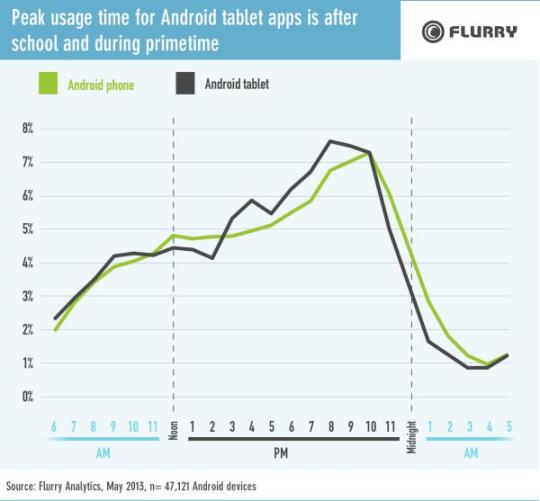
As this and our previous post have shown, while smartphones capture more time in specific app categories, such as Navigation and Photography, those tend to be categories of apps used in short bursts. Tablets are favored for longer-duration app categories, such as Games and Education, and so, on average, tablet users spend more total time using apps than smartphone users. That makes tablets particularly interesting to content creators and to advertisers.
Samsung is the dominant manufacturer of Android devices. As shown in this post, it is attracting a unique audience relative to other Android devices. Owners of Samsung devices spend more time in apps than owners of other Android devices, and they are also disproportionately likely to be members of psychographic segments (Personas) that are attractive to advertisers. In those respects, they are more similar to owners of iOS devices than owners of other Android devices are.
But compared to iOS, a smaller share of Android devices are tablets, and that percentage is even smaller for Samsung devices than for Android as a whole. So the question is: will Samsung make as big of an impact in the tablet market as it has in the smartphone market?
In some ways, this comes down to a question of how it will balance its resources between two different types of markets: relatively more affluent countries that were early adopters of connected devices so new growth is now coming mainly from tablet adoption versus less affluent countries where smartphone penetration is still relatively low, but growing quickly.
A focus on tablets could enable Samsung to better develop more of a true ecosystem of its own (especially considering that they can include connected TVs as part of that) and the higher profits that go with that. Riding the wave of global smartphone growth is more of a high volume / low margin strategy. Of course, they could try to compete at both ends of the market, but each individually may require a lot of resources because of Apple’s (and to a lesser extent, Amazon’s) strength in the tablet market and the number of hungry competitors anxious to grow along with the Android smartphone market. If they can do both, they will rule the Android Kingdom, and Samsung, rather than Google, will pose the greater threat to Apple.