By: Simon Khalaf, SVP, Product & Engineering, Publisher Products, Yahoo
In the seven years that Flurry has been reporting on mobile app usage, we have seen nothing but growth, and this year continued the trend.
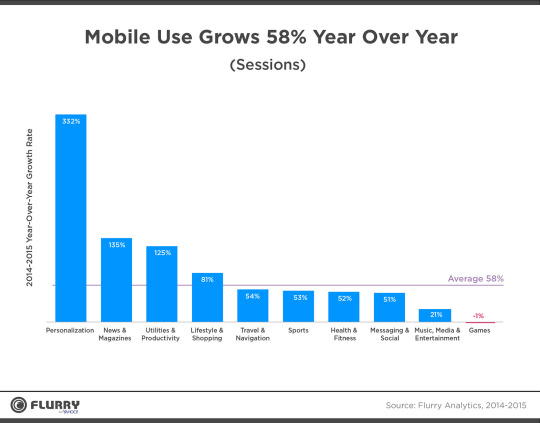
In 2015 overall app usage grew by 58%. In this context, we define app usage as a user opening an app and recording what we call a “session.” With the exception of Games, every app category posted year-over-year growth with Personalization, News & Magazines and Productivity leading the way with triple-digit growth.
Mobile Use Grows by 58% in 2015

The mobile industry has matured fast. In fact, 7 years into the mobile revolution, Flurry tracks over 2.1 billion smart devices, worldwide on a monthly basis. While the growth rate has declined (58% in 2015 compared to 76% in 2014 and 103% in 2013), it remains stunning as rates like these are rare in mature industries. What was even more impressive is the majority of that growth rate came from existing users versus new users. In fact, in 2015, we estimate that 40% of the 58% total growth in sessions came from existing users, compared to 20% in 2014 and 10% in 2013. This jives well with the report we released last summer, showing a fast increase in mobile addicts.
From a category perspective, four categories grew faster than the average.
Personalization apps saw their sessions balloon more than 332% in 2015. These apps range from Android lock-screens to Emoji keyboards. When we looked deeper into the category, we noticed that the majority of the growth is coming from Emoji apps (mainly keyboards) giving consumers the ability to share customized correspondence in their favorite messaging apps, such as Facebook Messenger, Whatsapp, Line and Snapchat. It is not a surprise then to see Kim Kardashian’s app “Kimoji” skyrocket to the number 1 spot on the Apple AppStore, on its launch day.
News and Magazine apps grew a whopping 135% in 2015. This growth validates the trend in media consumption we reported on last summer, signaling a shift in media consumption from television and PCs to smartphones in general, and phablets in particular, as we will discuss later.
Productivity apps continued the trend that started in 2014, with 125% sessions grow in 2015. In fact, more and more consumers, especially teens and college students are using their smartphones, phablets and tablets as their primary computing device and their sole device to access email and other productivity apps, like Google Docs, Quip, Slack and the Microsoft productivity suite.
Lastly, Lifestyle and Shopping apps grew 81% in 2015, following a 174% growth in 2014. This growth rate validates reports in early 2015 that mobile commerce is “growing like a weed” and already accounts for 33% of online commerce in the US and 40% of online commerce on a worldwide basis.
Inch by Inch, Mobile and its Apps Absorb the Media Industry

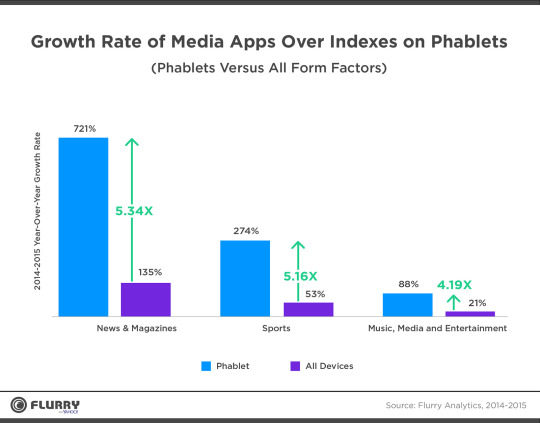
While the overall growth rate of 58% paints an interesting picture, our analysis dug a bit deeper by looking into growth rates cut by categories and form factors, especially phablets. In the above chart we compared the year-over-year session growth rates of the News & Magazine, Sports, and Music, Media, & Entertainment categories on phablets and all devices combined.
The growth rates of these three categories dramatically over-indexed on phablets compared to the growth rates on all devices combined. Growth in News & Magazines apps on phablets was 5.3x that of all devices, meaning phablet users are engaging in these apps at a much higher rate than the average smart device user. A similar pattern emerged for Sports and Music, Media & Entertainment apps, at 5.16x and 4.19x respectively. It appears that the extra inch of real estate has made the phablet the ultimate media consumption device.

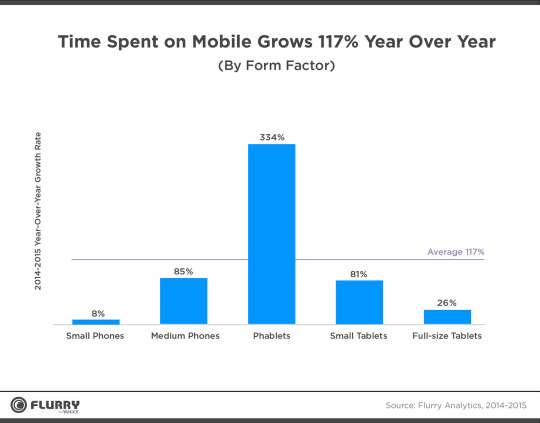
The picture got much clearer when we looked at year-over-year growth in time spent and cut that by form factor. Time spent on phablets grew 334% year-over-year (2.9 times more than the average), compared to 117% for all form factors. With time spent on mobile surpassing that on television, and phablets posting astonishing growth in media consumption, it appears that the cable industry will find in the phablet and its apps its long-awaited digital nemesis.
The Phablet: The Unstoppable Media Consumption Device

Once labeled a fad (even by us), Phablets have become the unstoppable media consumption device. 27% of all new devices activated for Christmas this year were phablets and 50% of all Android devices activated in the same timeframe were phablets.
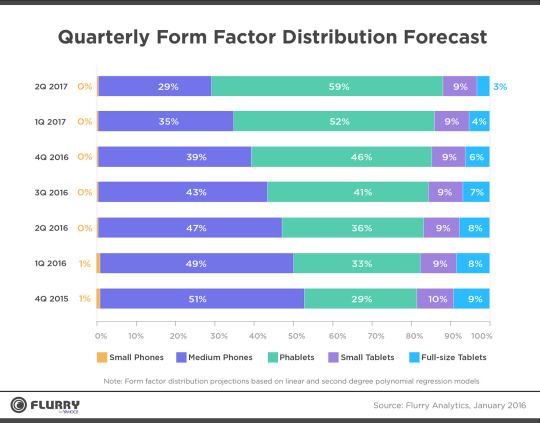
We say “unstoppable” because if the current trends hold, the phablet will become the dominant form factor by October of next year. The above chart shows our forecast for worldwide device distribution, by form factor through the middle of 2017. Also interesting to note is that small phones will be extinct by the second quarter of 2016. It’s clear consumers want their content, and they want it on a bigger screen.
3.2 Trillion Sessions and Counting
In 2015, Flurry tracked a mind boggling 3.2 trillion sessions. When we started 8 years ago, we never thought that our counters could reach these numbers. But, we have been fortunate enough to have a front row seat watching the mobile revolution unfold and absorb (and in some case demolish) industry after industry. On January 1st 2016, 12:01 am, our counters reset to zero and the guessing game started again. Which industry will mobile and its apps absorb in 2016?
We will have the answer a year from now, but for now: Here’s to Emojis
